Tool Search: MT EWS
The Early Warning System (EWS) Report details attendance, behavior and grade data for use in providing Montana OPI with data for import into the Early Warning System.
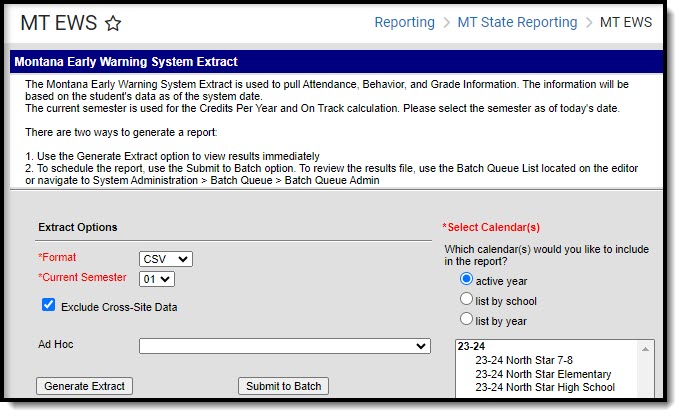 Montana Early Warning System Extract Editor
Report Criteria
Only students meeting the following criteria are included in the report:
- A student must have a primary enrollment record in the selected calendar as of the date the report was generated.
- The student's enrollment record must be tied to a state grade of 03-12.
- When a student has two primary enrollments, the student is reported twice, once for each enrollment in order to correctly report the attendance rate.
- The report can only be generated for a single calendar.
- When the report is generated for a future calendar, all students with an enrollment record in the future calendar that meet report requirements are reported.
- Students enrolled in a state excluded calendar or grade level, or who have an enrollment record marked State Exclude or No Show are not reported.
Generating the EWS Extract
- Select which Calendar will report data within the extract.
- Select the report Format (CSV is the default format).
- Select the Current Semester.
- Optional: Unmark the Exclude Cross-Site Data checkbox. See the Cross-Site Enrollment video for additional information.
- Select an Ad Hoc Filter (optional).
- Select how the report will be generated:
- Generate Report: The report will generate immediately and display in a new window in the designated format.
- Submit to Batch: Selecting this will send the extract to the Batch Queue where it will generate in the background when the system is able to process the request. Users can access the extract by clicking the Get the report link in the Batch Queue List. Users can also access the extract via the Batch Queue tool or by selecting the link within the Process Inbox message that appears once the extract is generated.
 Example of the EWS Extract - HTML Format
Report Layout
| Data Element | Description | Location | ||||||||||||||||
|---|---|---|---|---|---|---|---|---|---|---|---|---|---|---|---|---|---|---|
|
State Student ID |
The student's state ID.
Numeric |
Demographics > Student State ID
Person.studentStateID | ||||||||||||||||
| Last Name |
The student's last name. The Last Name only display in the HTML version of this report.
Alphanumeric |
Demographics > Last Name
Identity.lastName | ||||||||||||||||
| First Name |
The student's first name. The First Name only displays in the HTML version of this report.
Alphanumeric |
Demographics > First Name
Identity.firstName | ||||||||||||||||
| Grade Level |
The student's grade level. This only reports in the HTML report format.
Alphanumeric |
Enrollment > Grade Level
Enrollment.gradeLevel | ||||||||||||||||
| Enrollment Start Date | The start date of the student's enrollment record.
Date Field |
Enrollment > Start Date
Enrollment.startDate | ||||||||||||||||
| Enrollment End Date | The end date of the student's enrollment record.
Date Field |
Enrollment > End Date
Enrollment.endDate | ||||||||||||||||
| Att Rate |
The student's attendance rate.
Using the student's latest enrollment record, logic finds the number of days marked instructional the student is enrolled in for the Reporting Window. Logic then finds the number of days the student was absent during this time period.
An absent day is calculated as the sum of all minutes the student is marked with an attendance code in an instructional period with a status of 'A' and an excuse value of excused, unexcused or unknown.
The following calculation is used to find the Attendance Rate:
When the attendance rate quotient is greater than 1.00000 for a day, a value of 1.00000 is used when calculating the attendance rate using that day. Definition of Calculation Parts
When the report is generated prior to the first instructional day of the selected calendar, the attendance rate is calculated based on the latest enrollment record from the previous year (if one exists for the student in the district).
See the Required Data Setup section for more information about where to populate fields in Campus used in calculations mentioned above.
Numeric |
Calculated | ||||||||||||||||
| Prev Term F |
The number of F grades the student had in the previous term.
The following logic is used to identify and report the student's previous term F grades:
See the Required Data Setup section for more information about where to populate fields in Campus used in calculations mentioned above.
Numeric |
Student Information > General > Grades | ||||||||||||||||
| Prev Term A |
The number of A grades the student had in the previous term.
The following logic is used to identify and report the student's previous term A grades:
See the Required Data Setup section for more information about where to populate fields in Campus used in calculations mentioned above.
Numeric |
Student Information > General > Grades | ||||||||||||||||
| Behavior Event 120 Days |
The number of behavior events the student is tied to for the past 120 calendar days (this includes weekends, holidays, etc).
Logic finds the number of behavior events where the student has a role of Offender in the past 120 calendar days. When null, a value of 000 is reported.
See the Required Data Setup section for more information about where to populate fields in Campus used in calculations mentioned above.
Numeric |
Student Information > General > Behavior | ||||||||||||||||
| OOS Suspension Events 3yrs |
The number of behavior resolutions that are tied to the student that have a resolution of Out of School Suspension.
Logic finds the number of behavior resolutions tied to the student that have a Resolution Type mapped to a state type of Suspension, Out of School, Alt Setting or Out of School with no services and these resolutions occurred in the past 3 years.
|
Student Information > General > Behavior | ||||||||||||||||
| Credits Per Year |
The number of high school credits the student is earning per cohort year. When semester 1 is selected, the following calculation is used: Credits / (3-([CohortYearNCLB] - selected calendar end year))
When no transcript entries in the active year exist with the high school box marked, a null value is reported.
When no cohort year is assigned, a null value is reported.
For example, if a student's last transcript entry is in 2014-2015 school year, the selected calendar in extract editor is 2014-2015 and the student’s cohort year is 2016. This student has completed 2 years of high school and is in their first semester of their 3rd year. Student has earned a total of 12 credits.
So the student's credits per year is 6. When semester 2 is selected, the following calculation is used: Credits / (3-([CohortYearNCLB] - selected calendar end year - 0.5))
When no transcript entries in the active year exist with the high school box marked, a null value is reported.
When no cohort year is assigned, a null value is reported.
For example, if a student's last transcript entry is in 2014-2015 school year, the selected calendar in extract editor is 2014-2015 and the student’s cohort year is 2016. This student has completed 2 years of high school and is in their second semester of their 3rd year. Student has earned a total of 12 credits.
So the student's credits per year is 4.8.
See the Required Data Setup section for more information about where to populate fields in Campus used in calculations mentioned above.
|
Student Information > General > Transcript > High School Credit | ||||||||||||||||
| On Track |
Indicates the student is on track to graduate.
The following logic is used to report student On Track data:
Alphanumeric |
No Specific Path | ||||||||||||||||
| 60 Day Absences |
The number of absences during the last 60 calendar days.
When the attendance rate quotient is greater than 1.00000 for a day, a value of 1.00000 is used when calculating the student's absence for that day.
An absent day is calculated as the sum of all minutes the student is marked with an attendance code in an instructional period with a status of 'A' and an excuse value of excused, unexcused or unknown.
When the past 60 days spans multiple school years and the student has a primary enrollment within the district in both school years, logic will determine the last 60 instructional/attendance days from the date the report was generated.
When the past 60 days spans multiple school years, logic determines the prior 60 calendar days by using the system date and counting back the number of calendar days to the first instructional day in the selected calendar and then going to the previous year's school and calendar and counting back from the max attendance/instructional date for that calendar.
Numeric
|
Student Information > General > Attendance | ||||||||||||||||
| 90 Day Absences |
The number of absences during the last 90 calendar days.
the attendance rate quotient is greater than 1.00000 for a day, a value of 1.00000 is used when calculating the student's absence for that day.
An absent day is calculated as the sum of all minutes the student is marked with an attendance code in an instructional period with a status of 'A' and an excuse value of excused, unexcused or unknown. When the past 90 days spans multiple school years and the student has a primary enrollment within the district in both school years, logic will determine the last 90 instructional/attendance days from the date the report was generated.
When the past 90 days spans multiple school years, logic determines the prior 90 calendar days by using the system date and counting back the number of calendar days to the first instructional day in the selected calendar and then going to the previous year's school and calendar and counting back from the max attendance/instructional date for that calendar.
Numeric
|
Student Information > General > Attendance |
Required Data Setup
The following sections describe where data is set up and pulled from to populate each of the following fields.
Behavior Events 120 Days
Tool Search: Behavior Management
This field reports the number of behavior events the student is tied to for the past 120 calendar days (this includes weekends, holidays, etc). Logic finds the number of behavior events where the student has a role of Offender in the past 120 calendar days. If null, a value of 000 is reported.
The image below shows a user adding a behavior event for a student with a Role of Offender.
 Setting the Role of Offender on a Behavior Event
You can view a student's behavior events and their assigned Role via the Behavior tool.
 Example of a Student's Behavior Event Report Showing a Role of Offender
OSS Suspension Events 3 Years
Tool Search: Resolution Types > State Resolution Code
Tool Search: Student Behavior > Resolution Type, State Code
Tool Search: Behavior Management > Add Resolution > Resolution Type
This field reports the number of behavior resolutions that are tied to the student that have a resolution of Out of School Suspension.
Logic finds the number of behavior resolutions tied to the student that have a Resolution Type mapped to a state type of Suspension, Out of School, Alt Setting or Out of School with no services and these resolutions occurred in the past 3 years.
In order for resolutions to report values for this field, resolution types must be mapped to State Resolution Codes via the Resolution Types tool. In the image below, a user is setting a resolution of Out of School Suspension - 3 Days to have a State Resolution Code (Mapping) value. For reporting in this field, the State Resolution Code (Mapping) value must be set to Suspension, out of school, alt setting, or Suspension, out-of-school, without services.
 Establishing State Resolution Code (Mapping) Values for Resolution Types
Once State Resolution Code (Mapping) values have been set for Resolution Types, the field will report any student who has a Behavior Resolution in the last 3 years with a Resolution Type mapped to either Suspension, out of school, alt setting, or Suspension, out-of-school, without services.
 Example of a Reported Behavior Resolution
You can view a student's behavior events and their assigned Resolution Types and corresponding State Codes via the Behavior tool.
 Viewing a Student's Behavior Resolution Type and State Code
Attendance Rate
Tool Search: Grad Levels > Standard Day
Tool Search: Calendar > Student Day
Logic finds the total number of minutes the student is marked absent, minus any lunch time, minus any present minutes counted and then divided by the grade level standard day (if present), the calendar student day (if present) or 360.0.
The image below describes where Standard Day is set for each grade level.
 Grade Level Standard Day
The image below describes where the calendar Student Day is set.
 Calendar Student Day
Previous Term F
Tool Search: Grading Tasks > State Reported
Tool Search: Score Groups & Rubrics > State Score
Tool Search: Student Grades
This field reports the number of F grades the student had in the previous term.
Logic looks at enrollment start and end date and if end date is null or after final term start date, logic then looks at the Grades tab and finds the sum of all grades that are tied to a grading task marked as State Reported and tied to a State Grade of F.
The image below describes how a grading task is marked as State Reported.
 Example of a Grading Task being set as State Reported
The image below describes how a score is mapped to a State Score within a score group. This score group (and mapped score) must then be used when grading the student for the F grade to properly report.
 Setting a State Score Grade Values
The image below shows a view of a student's grades for grading tasks within a class.
 Viewing a Student's Grading Task Grades
Previous Term A
Tool Search: Grading Tasks > State Reported
Tool Search: Score Groups & Rubrics > State Score
Tool Search: Student Grades
This field reports the number of A grades the student had in the previous term.
Logic looks at enrollment start and end date and if end date is null or after final term start date, logic then looks at the Grades tab and finds the sum of all grades that are tied to a grading task marked as State Reported and tied to a State Grade of A.
The image below describes how a grading task is marked as State Reported.
Example of a Grading Task being set as State ReportedThe image below describes how a score is mapped to a State Score within a score group. This score group (and mapped score) must then be used when grading the student for the A grade to properly report.
 Setting a State Score Grade Values
The image below shows a view of a student's grades for grading tasks within a class.
Viewing a Student's Grading Task GradesCredits Per Year
Tool Search: Course > High School Credit
Tool Search: Graduation > NCLB Cohort Year
This field reports the number of high school credits the student is earning per cohort year.
Logic for this field is as follows:
- Logic finds the number of transcript entries that are marked with High School and finds the sum of credits the student has earned as of the date of report generation.
- Logic then finds the NCLB Cohort Year and subtracts this by the selected calendar's end year.
- 3 is then deducted from the value found in Step 2.
- The number of credits is then divided by the number found in Step 3.
The image below describes how a Course is marked as High School Credit.
 Setting a Course to High School Credit
The image below describes where NCLB Cohort Year data is pulled from. This year is determined based on the Grade 9 Date.
 NCLB Cohort Year
On Track
Tool Search: Academic Progress > Grad Progress
This field indicates if the student is on track to graduate.
The following logic is used to report student On Track data:
- When a student's enrollment record is tied to a State Grade Level of 09 and Semester 01 is selected in the extract editor, a value of Y is reported.
- Logic looks at the student's active academic plan to find the number of credits required to graduate and divides this number by 4.
- If the value in Credits Per Year is equal to or greater than the quotient or if Credits Per Year is null, a value of Y is reported.
- If the value in Credits Per Year is less than the quotient, a value of N is reported.
- If the student is not assigned an academic plan, a value of Y is reported.
For guidance on setting up and using Multi-Year Academic Planning, see this article.
The image below is an example of a student's Grad Progress (which includes many of the values used to calculate this field).
 Example of a Student's Grad Progress
Courses must be marked as High School Credit and posted to transcript (via the Transcript Post tool) in order to properly count towards a student's graduation progress. The image below is an example of a course being marked High School Credit.
 Marking a Course as High School Credit
You can also manually mark a course as High School Credit via the Edit button on a student's transcript.
 Manually Marking a Course as High School Credit
60 Day Absences
Tool Search: Grade Levels > Standard Day
Tool Search: Calendar > Student Day
The number of absences during the last 60 calendar days.
Logic determines this value as follows:
- Find the total number of minutes the student is marked absent, minus any lunch time, minus any present minutes counted and then divided by
- The grade level standard day, if present
- The calendar student day, if present (OR)
- 360.0
- When quotient is greater than 1.00000, report a 1.00000 for that day
- Round to the nearest hundred thousandth (5th decimal place)
- Sum the above calculation for each day
- Sum the calculations for Each Day for the enrollment period (enrollment start date to end date) to find the number of absences during the enrollment time period
The image below describes where a grade level Standard Day value is set.
Setting a Grade Level Standard DayThe image below describes where a calendar Student Day value is set.
Setting the Calendar Student Day Value90 Day Absences
Tool Search: Grade Levels > Standard Day
Tool Search: Calendar > Student Day
The number of absences during the last 90 calendar days.
Logic determines this value as follows:
- Find the total number of minutes the student is marked absent, minus any lunch time, minus any present minutes counted and then divided by
- The grade level standard day, if present
- The calendar student day, if present (OR)
- 360.0
- When quotient is greater than 1.00000, report a 1.00000 for that day
- Round to the nearest hundred thousandth (5th decimal place)
- Sum the above calculation for each day
- Sum the calculations for Each Day for the enrollment period (enrollment start date to end date) to find the number of absences during the enrollment time period
The image below describes where a grade level Standard Day value is set.
Setting a Grade Level Standard DayThe image below describes where a calendar Student Day value is set.
Setting the Calendar Student Day Value